Source RBI
Date : Feb 03, 2016
Consumer Confidence Survey: December 2015
The Consumer Confidence Survey provides an assessment of respondents’ perceptions on general economic conditions and own financial situation during the current period and a year ahead. The survey captures qualitative information on a three point scale i.e., improve, remain same or worsen, from respondents spread across six metropolitan cities viz. Bengaluru, Chennai, Hyderabad, Kolkata, Mumbai and New Delhi. The information so collected is analysed in two parts, viz., current situation as compared with a year ago and the expectations for a year ahead. In the latest Consumer Confidence Survey, field work was carried out between December 21 and December 31, 2015. The salient findings of the survey, based on the responses of around 5,100 respondents are presented below.
Highlights:
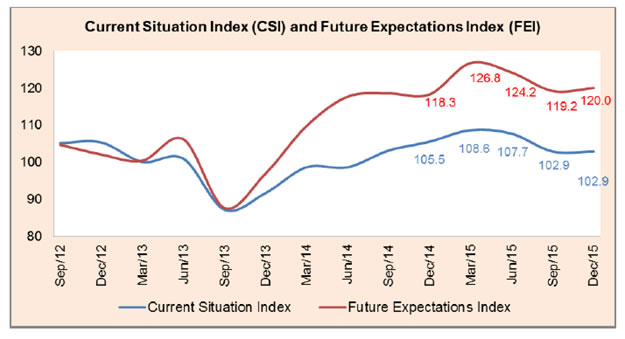
I. Current Situation Index (CSI) remained unchanged at its level as in the last quarter (September 2015). Future Expectations Index (FEI) increased fractionally on account of increase in positive perceptions on economic conditions, income and employment in the current round of survey as compared to September 2015 round.
II. The one-year ahead outlook on economic conditions has been consistently better than the positive perceptions on current economic conditions as compared to a year ago. Continuing this trend, such perceptions of the respondents in December 2015 round of the Survey indicated marginal improvement in the general economic situation, as measured by net response, both for the current as also for a-year ahead period (Table 1).
III. The optimism regarding increase in future income (one-year ahead) is higher with net response improving by 2 percentage points as compared with September 2015 round of survey. The net response on current income perceptions as compared to one-year ago, however, showed deterioration by about 1 percentage point during the December 2015 round of Survey as compared to preceding round (Table 2).
IV. The respondents reported increase in negative perceptions on spending during current period as compared to one-year ago and one-year ahead as compared to current situation. However, the related net responses on current and future spending remained high at around 68 per cent during the December 2015 round of survey (Table 3).
V. Similar perceptions were observed relating to spending on essential items and more than 80 per cent respondents reported increase for the current as well as future period. Further, the proportion of respondents reporting increase in current as well as future spending on non-essential items, increased as compared to September 2015 round of survey (Tables 4 and 5).
VI. Employment outlook for one-year ahead as well as current scenario as compared to previous year, improved in this round as compared to previous round of the survey. The related net response for the current period which had reached negative zone, albeit marginally, in September 2015, bounced back in positive territory during this round of the survey. Around one-half of the respondents expected improvement in employment situation a-year ahead (Table 6).
VII. Current sentiments on price levels as compared to one-year ago showed a marginal improvement while future expectations for one-year ahead remained unchanged, in this round of the survey. However, similar perception on current inflation and inflation expectations worsened (Tables 7 and 8).
1 The September 2015 round of the survey data was published on September 29, 2015 on RBI website. The survey results are based on the views of the respondents and are not necessarily shared by the Reserve Bank of India.