Macroeconomic Impact of Demonetisation- A Preliminary Assessment
Macroeconomic Impact of Demonetisation –
A Preliminary Assessment*
Demonetisation announced on November 8, 2016 was aimed at addressing corruption, black money, counterfeit currency and terror financing. Although demonetisation holds huge potential benefits in the medium to long-term, given the scale of operation, it was expected to cause transient disruption in economic activity. The analysis in this paper suggests that demonetisation has impacted various sectors of the economy in varying degrees; however, in the affected sectors, the adverse impact was transient and felt mainly in November and December 2016. The impact moderated significantly in January 2017 and dissipated by and large by mid-February, reflecting the fast pace of remonetisation. The latest CSO estimates suggest that the impact of demonetisation on GVA growth was modest. Currency squeeze due to demonetisation along with seasonal factors pushed food inflation significantly down but has not had much impact on inflation excluding food and fuel. A surge in deposits led to a sharp expansion in the consolidated balance sheet of scheduled commercial banks and created large surplus liquidity conditions. These were managed by the Reserve Bank of India through a mix of conventional and unconventional policy instruments. There has not been any significant impact on the external sector. There has been a sharp increase in the number of accounts under the Pradhan Mantri Jan Dhan Yojana and the deposits in such accounts have also surged. Financial re-intermediation may have received a boost following demonetisation. An important consequence of demonetisation has been the sharp increase in the use of digital transactions.
Introduction
On November 8, 2016, it was decided to demonetise high value currency notes of denomination of ₹ 1000 and ₹ 500 (called specified bank notes – SBNs). Such notes, valued at ₹ 15.4 trillion, constituted 86.9 per cent of the value of total currency in circulation. The decision was in continuation of a series of measures taken by the Government of India during last two years aimed at eliminating corruption, black money, counterfeit currency and terror funding. The decision was guided by the aim of reaping its enormous potential medium-term benefits in the form of reduced corruption, greater digitisation of the economy, increased flow of financial savings and greater formalisation of the economy. All of these would lead to higher GDP growth and tax revenues that could be used by the Government for inclusive and stronger economic growth within the norms of fiscal prudence, besides contributing to overall improvement in business environment.
India has traditionally been a cash intensive economy. According to an estimate, about 78 per cent of all consumer payments in India are effected in cash1. It was, therefore, obvious that currency squeeze during the demonetisation period would have had some adverse impact on economic activity, although such impact was expected to be transient. In order to mitigate the adverse impact on the common man as also on economic activity, a series of measures were undertaken, keeping in view the feedback received from various quarters (Annex Table 1).
This report makes a preliminary assessment of the macroeconomic impact of demonetisation. Section I assesses the impact of demonetisation on growth and inflation. The impact of demonetisation on the financial sector covering balance sheet changes of scheduled commercial banks; liquidity conditions; monetary policy transmission; non-banking financial intermediaries; and, Jan Dhan accounts is set out in Section II. Financial market developments post demonetisation are detailed in Section III. The external sector impact, with a focus on balance of payments and demand for gold, is covered in Section IV. The impact on digital modes of payments is outlined in Section V. The overall assessment of the impact of demonetisation is presented in Section VI.
I. Growth and Inflation
This section assesses the impact of demonetisation on growth and inflation and their outlook in the context of subsequent remonetisation.
I.1 Growth
The growth of gross value added (GVA)2 is expected to have been impacted primarily by the liquidity shock, i.e., limited access to currency as a medium of exchange for effecting transactions in the economy. This impact is expected to have worked through two channels: (a) decline in demand due to shortage of cash to make payments, mostly on discretionary spending; and (b) disruption in production activity due to man hours lost as some workers, especially those in the unorganised sector who get their wages paid in cash, experienced temporary loss of work. The construction sector and some of the labour-intensive manufacturing sectors such as textiles, leather, gems and jewellery and the transportation sector engage casual/migrant labourers extensively. The loss of wage income for workers is also expected to have caused a drag on consumption demand.
The wealth effect is another channel through which demonetisation could have impacted economic activity. However, the precise estimate of currency that returned to the banking system is not yet available as the reconciliation process is still on. Hence, the adverse wealth effect on account of SBNs not returning to the banking system could be assessed only after the reconciliation exercise is complete.
The Reserve Bank in its Fifth Bi-monthly Monetary Policy Statement on December 7, 2016 placed the GVA growth for 2016-17 at 7.1 per cent, which was lower than 7.6 per cent GVA growth projected in its Fourth Bi-monthly Monetary Policy Statement of October 4, 2016. The 50 basis points (bps) downward revision in GVA growth was on account of 35 bps loss in momentum, which was reflected in GVA growth in Q2 estimated by the Central Statistics Office (CSO) in November 2016 and 15 bps on account of the adverse impact of demonetisation. The CSO in its first advance estimates released on January 6, 2017 placed the GVA growth for 2016-17 at 7.0 per cent.
The overall GVA growth in the Sixth Bi-monthly Monetary Policy Statement on February 8, 2017 was pegged lower at 6.9 per cent. The impact of demonetisation on GVA growth was estimated at about 33 bps for the full year 2016-17. After the peak impact in Q3, GVA growth was estimated to strengthen with the progressive remonetisation in Q4. As per the second advance estimates of the CSO released on February 28, 2017, GVA growth for 2016-17 is pegged at 6.7 per cent, which is about 30 bps lower than what was estimated on January 6, 2017. Importantly, Q3 growth (at 6.6 per cent) was only marginally lower than that recorded in Q2 (6.7 per cent), thereby suggesting that demonetisation had only a modest impact on growth in Q3 of 2016-17.
I.1.1 Impact on Growth: 2016-17
The underlying factors for GVA growth estimate of 6.9 per cent as presented in the Sixth Bi-monthly Monetary Policy Statement on February 8, 2017 are detailed below.
I.1.1.1 Organised Sector
Although the organised sector on the whole remained resilient, some manufacturing and services segments were adversely affected.
Within industry, electricity generation was expected to have been impacted the least, with the share of the unorganised sector being very low and the share of informal employment close to zero. Weak demand for electricity was already a challenge before demonetisation, with power generation in excess relative to demand. In November and December, however, electricity generation increased by 8.9 per cent and 6.3 per cent, respectively, which was higher than the average growth of 4.5 per cent recorded during April-October, 2016 (Table 1). In January 2017, however, it decelerated to 3.9 per cent. Coal production also increased by 6.4 per cent in November, 4.4 per cent in December and 4.8 per cent in January (as against contraction in the previous three months).
Organised manufacturing was impacted adversely as evident from (i) the decline in the sales of fast moving consumer goods (FMCG) (as per the Nielsen survey) and automobiles in all the months from November to January; (ii) contraction in the manufacturing purchasing mangers’ index (PMI) in December for the first time in 2016; and (iii) deceleration in export growth during November (Table 1). The data released by the Society of Indian Automobile Manufacturers (SIAM) suggested that auto sales contracted by 4.7 per cent in January 2017 but returned to expansion mode (by 0.9 per cent) in February. In the two-wheeler segment, the impact was severe, especially in rural pockets. The PMI for manufacturing in January and February 2017 as well as export growth in December 2016 and January 2017 rebounded.
As regards sales of consumer goods, the 2016 festival season was the best since 2012, coming as it did on the back of a healthy monsoon and the 7th pay commission award. However, demonetisation impacted sales performance of consumer durables industry (Table 2). Manufacturers also cut production due to rising inventories. The adverse impact of demonetisation on disposable incomes and hence on consumer spending resulted in slowdown in domestic demand for apparels and other end-products of textile industry. The impact was reportedly most severe for winter-wear retailers and manufacturers focused on the domestic market, who make a significant part of their annual sales during the period October-February. Although from the manufacturers’ end, shipments typically take place by September-October, pressure on sales in the retail space during the subsequent peak season would have indirectly affected manufacturers. Overall, the impact was expected to have been felt across the textile value chain.
The organised corporate sector appeared to have remained largely resilient to the impact of demonetisation going by the quarterly results announced for Q3 (see Table 17 in Section III), which is the key indicator for estimating growth in manufacturing GVA. However, according to the Centre for Monitoring Indian Economy (CMIE), new investment proposals dropped to ₹ 1.41 trillion in Q3 as against an average of ₹ 2.36 trillion in the preceding nine quarters. In terms of number of new investment proposals, Q3 was the lowest in a decade.
Some segments in the services sector also appeared to have been adversely impacted. The services PMI fell sharply from 54.5 in October to 46.7 and 46.8 in November and December, respectively, entering contraction territory for the first time after June 2015. Despite improvement in January to 48.7, it remained in contraction mode. In February, however, the index at 50.3 returned to modest expansion mode. Production of cement, one of the main indicators for the construction sector, decelerated sharply in November, and contracted by 8.7 per cent and 13.3 per cent in December 2016 and January 2017, respectively. Sales of commercial vehicles – an indicator for transportation activity – contracted by 11.6 per cent in November, 5.1 per cent in December 2016, and 0.7 per cent in January 2017, as against an average growth of 6.9 per cent during April-October 2016. In February, it increased by 7.3 per cent. Growth in sales of passenger vehicles also decelerated to 1.8 per cent in November and contracted by 1.4 per cent in December, but rebounded sharply to 14.4 per cent in January 2017 and expanded by 9 per cent in February.
Organised real estate essentially reflected the performance of listed real estate companies. Although the S&P BSE realty index declined significantly after demonetisation till end-December 2016, it rebounded subsequently (see Table 16 in Section III). While real estate prices reportedly held up, sales and new launches declined. According to Knight Frank India3, demonetisation move created a real dent in the residential real estate sector, pulling back the last quarter trend of residential sales substantially across the cities. After demonetisation, expectations of downward correction in house prices seemed to have impacted registrations in some of the cities in November. In December, however, registrations appeared to have bounced back, though they were lower than in October.
Two major components of the organised sector under services, viz.; financial services and public administration, imparted significant resilience to the overall GVA growth momentum. The average growth of deposits and credit (a key indicator for financial services) remained largely unchanged after demonetisation. Insurance premiums collected by insurance companies, another key indicator, recorded a year-on-year (y-o-y) increase of 72.1 per cent in November (set out in detail in Section II), before moderating in December 2016 and January 2017. Growth in public administration (i.e., revenue expenditure net of transfers) exhibited robust growth in H1, which was expected to continue through H2. In these two segments (i.e., financial services and public administration), the unorganised sector’s share is zero and informal employment is negligible.
In transportation, domestic air passenger traffic growth was robust at 22 per cent in November and 23.9 per cent in December and 25.6 per cent in January 2017 (similar to the average growth in April-October). Domestic air cargo traffic contracted by 0.6 per cent in November, but revived to 7.5 per cent in December and 10.1 per cent in January. Growth in international air cargo traffic (at 15.4 per cent) and international passenger traffic (at 7.7 per cent) remained strong in November. The upbeat trend continued in December and January. Service tax collections – a lead indicator for communication and other services –registered a growth of 43.9 per cent in November, but decelerated to 13.1 per cent in December and further to 12.1 per cent in January.
I.1.1.2 Unorganised/Informal Sector
The unorganised sector accounts for about 45 per cent of GVA and 82 per cent of total employment (Table 3). Hard data on the unorganised sector are collected only infrequently and then used for fixing the base period benchmark by the CSO (i.e., 2011-12 for the new GVA/GDP series). For subsequent years, estimates are extrapolated from the base year benchmarks using suitable proxy indicators from the organised sector or by applying past trends. Following the standard “labour input (LI)” methodology, the number of workers (from the 68th round of Employment and Unemployment Survey, NSSO) and the value added per worker (from the 67th round of Enterprises Survey of NSSO) in the industry are used for fixing the base year estimates. For example, for estimating the unorganized manufacturing GVA, labour input (LI) and GVA per effective worker (GVAPEW) are fixed for the base year 2011-12, and subsequent quarterly/annual estimates are generated by applying the IIP growth, until data from the Annual Survey of Industries (ASI) become available (see Annex A and B for details). Similarly, for unorganised services, the indicators used for estimating quarterly/annual GVA are sales of motor vehicles (for maintenance and repair of vehicles); sales tax growth (for retail trade); service tax growth (for repair of personal and household goods); corporate performance (for hotels and restaurants); and growth in registered vehicles (for transportation). Therefore, in the absence of any hard data on the unorganised sector, the assessment was based on the indicator approach used by the CSO.
In agriculture and plantation activity, rabi sowing, which was higher by 4.8 per cent in November 2016 than a year ago, picked up subsequently and was about 6 per cent higher than last year by February 3, 2017, covering about 101 per cent of the normal area sown. While agriculture accounts for the largest share of the informal workforce and is highly cash sensitive, the impact of demonetisation on production was expected to be muted and transient, primarily due to the healthy progress in rabi sowing. The second advance estimates suggested that the food grains production increased by 8.1 per cent in 2016-17, implying that the GVA growth in agriculture was likely to have rebounded strongly after consecutive droughts in the preceding two years. GVA in unorganised manufacturing, for which the index of industrial production (IIP) serves as the key proxy indicator, would have experienced a slowdown, as the manufacturing IIP contracted by 1.7 per cent in December, after recording 5.5 per cent y-o-y increase in November. It, however, expanded by 2.3 per cent in January. Growth in service tax collections – an indicator for GVA from unorganised services – slowed down significantly in December 2016 and January 2017 (Table 1). Among the other lead indicators of unorganised sector services GVA, sales of motor vehicles contracted over three successive months before reviving in February, while foreign tourist arrivals registered a strong growth of 9.2 per cent in November 2016, 13.6 per cent in December 2016 and 16.4 per cent in January 2017 (Table 1).
Based on the assessment of lead indicators commonly used by the CSO for estimating GVA in both the organised and unorganised sectors – particularly the behaviour of these indicators beginning January 6, 2017 when the CSO released the first advance estimates of GVA – the GVA growth for 2016-17 as a whole was estimated by the Reserve Bank at 6.9 per cent, as against 7.6 per cent communicated by the Reserve Bank before demonetisation (Table 4). GVA growth was estimated to have decelerated significantly in Q3, but was estimated to recover robustly from the latter part of Q4 of 2016-17, highlighting the transient nature of the impact of demonetisation on growth. Of the 70 bps downward revision in overall GVA growth in 2016-17, 33 bps was estimated on account of demonetisation and the remaining 37 bps due to the loss of momentum in Q2 (as per quarterly data released by the CSO in November 2016), which was assumed to have persisted through H2.
The CSO’s second advance estimates of GVA for 2016-17 released on February 28, 2017 pegged the GVA growth lower at 6.7 per cent, which is about 30 bps lower than 7 per cent estimated on January 6, 2017 (Table 5). Importantly, the Q1 and Q2 growth numbers have been revised down (primarily on account of significant upward revision in growth numbers for the corresponding quarters of last year). It is significant to note that GVA growth in Q3 at 6.6 per cent suggests only a modest impact of demonetisation (in terms of y-o-y growth relative to Q2). Disaggregated component wise GVA estimates suggest that demonetisation impact was reflected to a large extent in real estate and construction activity in Q3. However, stronger growth in agriculture, manufacturing, electricity, and mining cushioned the overall GVA growth in Q3.
I.1.2 Growth Outlook for 2017-18
The factors underlying GVA projections for 2017-18 as presented in the Sixth Bi-monthly Monetary Policy Statement on February 8, 2017 are explained below.
As the impact of the liquidity shock was assessed to largely dissipate by mid-February, growth was estimated to bounce back in 2017-18. With rapid remonetisation, pent up demand was likely to boost consumption demand. After demonetisation, some workers were reported to have received wage payments in advance, but in the form of credit to bank deposits. Since the propensity to consume is high for the working class population, their consumption was expected to increase with the improving access to cash. Accordingly, consumption demand was expected to get a boost in 2017-18 as compared with the second half of 2016-17.
Investment demand was also expected to benefit from the improved transmission of the cumulative 175 bps cut in the repo rate to lending rates amidst structural surplus liquidity conditions in the banking system. Many banks reduced their MCLR post-demonetisation (see Section II for details). The positive revenue impact stemming from better reporting of transactions and tax enforcement/compliance was also expected to create space for higher public investment. Economic activity in the cash-intensive sectors such as retail trade, hotels and restaurants, and transportation, as well as in the unorganised sector, was expected to be rapidly restored. The overall business climate should improve with the medium-term positive effects of demonetisation starting to gain traction. Some of the indicators available, such as PMI for manufacturing and services in February, sales of passenger cars in January and February, and an upturn in manufacturing production growth in January pointed to signs of a recovery in growth from the November/December lows. The emphasis given in the Union Budget to curb the parallel economy, and the expected buoyancy in collection of direct taxes as per the budget estimates was expected to ultimately get manifested in greater formalisation of the economy. The measures announced in the Union Budget 2017-18 for the infrastructure sector, MSMEs, low cost housing and agriculture were expected to strengthen the recovery. Taking into account these likely drivers of growth, and the baseline assumptions of a normal monsoon and the budgeted fiscal deficit of 3.2 per cent of GDP, GVA growth was projected to strengthen to 7.4 per cent in 2017-18 (Table 6)4.
| Table 6: Projected GVA Growth | |
| (y-o-y in per cent) | |
| Period | 2017-18 |
| Q1 | 7.1 |
| Q2 | 7.5 |
| Q3 | 7.7 |
| Q4 | 7.5 |
| Financial Year | 7.4 |
| Source: RBI. | |
Most of the external agencies – both domestic and international – lowered their growth projections for India in 2016-17, from a range of 7.0-7.9 per cent before demonetisation to 6.3-7.3 per cent after demonetisation. For 2017-18, however, they have projected a significantly higher GDP growth, in the range of 6.75-7.8 per cent (Annex Table 2).
I.2 Inflation
The impact of demonetisation on inflation in the near-term stemmed mainly from moderation in food inflation, especially perishables, as inflation excluding food and fuel remained broadly unaffected. With demand expected to recover from the latter part of Q4 of 2016-17, inflation risks to CPI excluding food and fuel and headline inflation are, therefore, tilted to the upside.
I.2.1 Food Inflation
Food inflation declined from 3.7 per cent (year-on-year, y-o-y) in October 2016 to 2.6 per cent in November, to 2.0 per cent in December and further to 1.3 per cent in January 2017. This was mainly on account of vegetables and pulses. Vegetable prices declined by 6.2 per cent on a month-on-month (m-o-m) basis in November 2016 and further by 11.7 per cent in December 2016. The vegetable price decline continued in January 2017 albeit at a lower rate of 4.7 per cent. Pulses prices declined by 7.4 per cent between October 2016 and January 2017. The sharp decline in prices of pulses and vegetables was due to a number of factors.
In the case of pulses, there was a record production of kharif pulses of 8.7 million tonnes due to good monsoon aided by favourable weather conditions. Adequate provision of quality seeds, fertiliser and pesticides, and timely hike in minimum support prices also provided suitable incentives. The record level of production, achieved after two consecutive years of monsoon and crop failures, helped in sharp reduction in prices of pulses, in as much as prices crashed even below the minimum support prices (MSPs) in some of the mandis.
During the November-January period every year, vegetable prices usually exhibit seasonal moderation; however, during this season, the decline in prices was more pronounced than what was seen during the corresponding periods of previous years. The seasonal decline in prices seen in CPI vegetables is primarily driven by potato, onion and tomato which together constitute a substantial share of CPI vegetables sub-group weight (at around 40 per cent of the vegetables index). During November 2016 to January 2017, while seasonal moderation was seen for potato and tomato prices, there was also a broad based decline in prices across vegetables such as cabbage, cauliflower, palak/other leafy vegetables, brinjal, gourd, peas and beans, which usually contribute little to the observed seasonal moderation in CPI-vegetables (Chart 1). The large arrival of fresh winter crop, given good moisture content in soil following normal monsoon, contributed to the larger than usual seasonal fall in vegetables prices. As the transactions in fruits and vegetables have always been cash intensive, following demonetisation, as cash ran dry, there was some compression in demand for fruits and vegetables. Anecdotal evidence also pointed to some distress sales by farmers, given the perishable nature of green vegetables and fruits. On the whole, demonetisation induced supply chain disruptions, which could have pushed up prices, seemed to have been more than counteracted by demand compression and distress sales of vegetables.

The sharp decline of about 240 bps in food inflation between October 2016 and January 2017 reflected the combined impact of record pulses production, large winter arrivals of vegetables and compression in demand due to demonetisation. This was despite large unfavourable base effects.
Daily retail prices data, as monitored by the Ministry of Consumer Affairs, Food and Public Distribution, for the month of February 2017 suggest that the rate of decline in prices of vegetables has moderated considerably. While onion and potato prices have continued to decline, tomato prices are picking up (Annex Table 3). This is also broadly corroborated by the movement in fortnightly food prices monitored by the Reserve Bank (Annex Table 4). Thus, in the case of vegetables, there are some incipient signs of prices getting stabilised. Prices of pulses continued to register significant declines in February. Prices of cereals on the other hand, registered an increase. Hence, the overall food inflation trajectory in the near-term would also be determined by evolving pulses deflation and cereal price movements.
I.2.2 Inflation Excluding Food and Fuel
Even though discretionary consumer spending on items such as clothing and footwear, household goods and services, recreation and amusement, and personal care and effects (which constitute 16 per cent of the CPI basket) may have been impacted, the prices of these items weathered the transitory effects of the cash shortage as they are normally revised according to pre-set cycles and showed minimal changes post demonetisation. Prices of housing, health, transport and communication, pan, tobacco and intoxicants, and education – together accounting for 31 per cent of the CPI basket – also remained largely unaffected. Although the real estate sector was in stress, no correction was seen in rentals. Barring new rental agreements, existing contracts have pre-set annual rental increase clauses of a fixed percentage. Thus, on the whole, inflation excluding food and fuel during November 2016 – January 2017 was not impacted due to demonetisation (Table 7).
I.2.3 Headline Inflation
With a weight of 46 per cent, the sharp fall in food inflation by about 240 bps during November 2016 – January 2017 pulled down the headline CPI inflation by around 100 bps to 3.2 per cent in January 2017, the lowest inflation reading since the publication of the all India CPI inflation series. Inflation excluding vegetables, which was at 5.0 per cent in October 2016, moderated marginally to 4.8 per cent in November 2016 and remained unchanged at that level in December 2016 before moderating to 4.5 per cent in January 2017. The moderate softening in CPI excluding vegetables suggests the larger role of vegetables sub-group in the observed sharp decline in inflation in recent months. Moreover, inflation in CPI excluding food (which is about 54 per cent of CPI basket) edged up from 4.6 in November to 4.7 per cent in December 2016 and further to 4.9 per cent in January 2017.
I.2.4 Inflation Outlook
Going forward, unfavourable base effects5 in February could push inflation up. The base effect remains neutral in March 2017. There is a considerable uncertainty as to how vegetables prices will pan out over the coming months. Given that recent vegetables price declines have also been influenced by demonetisation induced distress sales in addition to seasonal factors, it is possible that with significant remonetisation having taken place, there could be some reversal in vegetables prices in March and beyond. Thus, with inflation excluding food and fuel remaining sticky, the headline inflation outcome in the near term will depend on how food price dynamics evolve.
II. Financial Sector
This section sets out the impact of demonetisation on banks; liquidity conditions and transmission of monetary policy; non-banking financial intermediaries; and, Jan Dhan accounts.
II.1 Balance Sheet and Profitability of Banks
Demonetisation has had a significant impact on the balance sheet of scheduled commercial banks (SCBs), both in terms of size and composition.
II.1.1 Balance Sheet Effects
Decline in currency in circulation on account of demonetisation led to a surge in bank deposits. The demonetised notes were accepted at bank counters till December 30, 2016. Between October 28, 2016 and January 6, 2017 (i.e., days immediately prior to and after demonetisation for which fortnightly banking system data are available), total currency in circulation declined by about ₹ 8,800 billion. This, in turn, was largely reflected in sharp increase of about ₹ 6,720 billion in aggregate deposits of the banking system even after outflows in NRI deposits during the period.
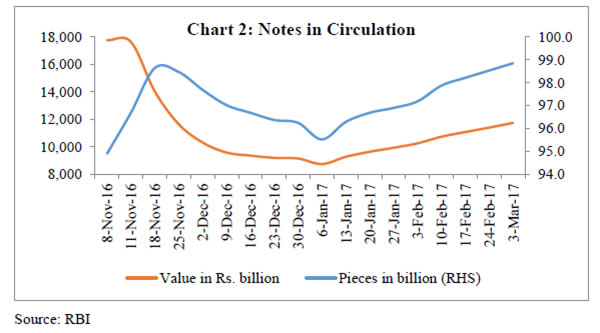
Remonetisation has been progressing at a fast pace. Between end-December 2016 and early March 2017, there was a net increase in currency in circulation by about ₹ 2,600 billion. During this period, deposits with banks also declined moderately.
Importantly, currency in circulation in terms of number of pieces and value have been steadily rising since early January 2017 (Chart 2).
Banks furnish data on their major assets and liabilities on a fortnightly basis. As per data available for the reporting Fridays of October 28, 2016 (prior to demonetisation) and February 17, 2017 (latest available), aggregate deposits of SCBs increased by ₹ 5,549 billion during the period (Table 8).
Bulk of the deposits so mobilised by SCBs have been deployed in: (i) reverse repos of various tenors with the RBI; and (ii) cash management bills (CMBs) issued under the Market Stabilisation Scheme (which is a part of investment in government securities in the balance sheet of banks). Loans and advances extended by banks increased by ₹ 1,008 billion. The incremental credit deposit ratio for the period was only 18.2 per cent.
Additional deposits mobilised by commercial banks have been largely deployed in liquid assets. This may be due to the expected transitory nature of the bulk of such deposits and weak demand as reflected in the subdued growth of credit.
II.1.2 Profitability of Banks
Banks’ net profits essentially reflect the difference between interest earned on loans and advances and investments, and interest paid on deposits and borrowings, adjusted for operating costs and provisions. Loans and advances and investments, which are the main sources of interest income, together constitute more than 85 per cent (61 per cent accounted for by loans and advances and 25 per cent by investments) of banks’ consolidated balance sheet. Post-demonetisation, there has been a surge in the current account and saving account (CASA) deposits of banks. The sharp increase of 4.1 percentage points in the share of CASA deposits in aggregate deposits to 39.3 per cent (up to February 17, 2017) resulted in a reduction in the cost of aggregate deposits. The cost of CASA at 3.2 per cent is significantly lower than the weighted average term deposit rate at 7.1 per cent. Banks have also lowered their term deposit rates; the median term deposit rate declined by 38 bps during November 2016-February 2017. As detailed in Section II.2, the decline in the cost of funding resulted in decline in the 1-year median marginal cost of funds based lending rate (MCLR) by as much as 70 bps post-demonetisation (November 2016-February 2017).
Banks earned return of around 6.23-6.33 per cent under reverse repos and market stabilisation scheme (MSS)6 as against the cost of CASA deposits of around 3.2 per cent. Accordingly, for an average deployment of about ₹ 6 trillion in a quarter under reverse repos and MSS securities, banks’ net interest income from increased deposits is estimated at about ₹ 45 billion in a quarter after demonetisation. Banks continue to enjoy the increased share of low cost CASA deposits, although it is gradually declining with the increase in currency in circulation.
The increase in net interest income would need to be adjusted for the cost of managing withdrawal of SBNs and injection of new bank notes (such as calibration of ATM machines, staff overtime, security arrangements, lower fees/waiver of fees on digital modes of payments), the exact details of which are not available at this stage.
II.2 Liquidity Conditions and Monetary Policy Transmission to Lending Rates
II.2.1 Liquidity Conditions
With the return of SBNs to the banking system, while currency in circulation contracted, deposits in the banking system surged. The sudden increase in deposits (given the gradual replacement of SBNs by new notes) created large surplus liquidity conditions in the banking system, which could be divided into four distinct phases in terms of how liquidity was managed by the Reserve Bank using different instruments (Chart 3). The active liquidity management was necessitated to ensure that the operating target remained aligned to the policy repo rate.
In the first phase (November 10 to November 25), the Reserve Bank absorbed the excess liquidity through variable rate reverse repos of tenors ranging from overnight to 91 days under its Liquidity Adjustment Facility (LAF). The outstanding amount of surplus liquidity absorbed through reverse repos (both variable rate and fixed rate auctions) reached a peak of ₹ 5,242 billion on November 25.
In the second phase (November 26 to December 9), the liquidity surplus was managed through a mix of reverse repos and the application of the incremental cash reserve ratio (ICRR) of 100 per cent on the increase in net demand and time liabilities between September 16 and November 11, 2016. The ICRR helped drain excess liquidity in the system to the extent of about ₹ 4,000 billion during the fortnight ended December 9, 2016.
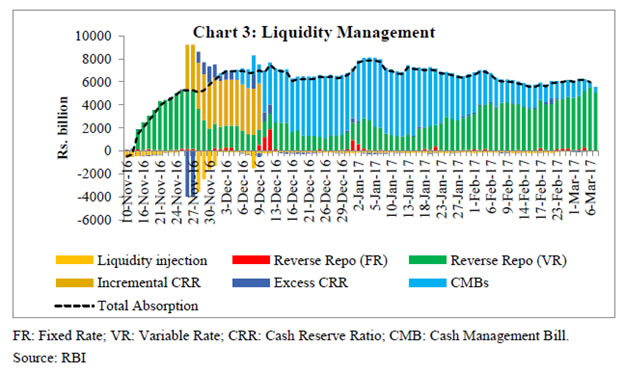
In the third phase (December 10 to January 13), surplus liquidity conditions were managed through a mix of reverse repos and issuances of cash management bills (CMBs) under the MSS. With the enhancement of the limit on issuance of securities under the MSS from ₹ 300 billion to ₹ 6,000 billion on December 2, 2016 by the Government of India, the Reserve Bank withdrew the ICRR effective the fortnight beginning December 10, 2016. Between December 10, 2016 and January 13, 2017, surplus liquidity in the system was managed by a mix of fine-tuning reverse repo operations and auctions under the MSS. The peak liquidity absorbed was ₹ 7,956 billion on January 4, 2017 (₹ 2,568 billion absorbed through reverse repos and ₹ 5,466 billion through CMBs). Subsequent to the advance tax payment in mid-December, a part of the excess liquidity was offset by the build-up in government cash balances. The surplus liquidity in the system declined to ₹ 7,269 billion on January 13, 2017.
In the fourth phase (since January 14), the Reserve Bank has increasingly used reverse repo operations to absorb surplus liquidity, particularly the liquidity released through the maturing CMBs, as the magnitude of surplus liquidity has been moderating in sync with remonetisation. Of the total surplus liquidity (net of injection under the LAF) in the system of ₹ 5,537 billion on March 7, 2017, ₹ 500 billion was absorbed through CMBs under the MSS and the remaining through variable rate reverse repo auctions under the LAF.
The surplus liquidity is expected to decline going forward as remonetisation progresses further, which will result in decline in deposits with the banking system. Despite this, however, surplus liquidity conditions are likely to persist for some more time.
II.2.2 Monetary Policy Transmission to Lending Rates
Surplus liquidity conditions have helped facilitate the transmission of monetary policy to market interest rates. Post demonetisation, several banks lowered their domestic term deposit rates and lending rates. The median term deposit rates of SCBs declined by 38 bps during November 2016-February 2017 (Table 9), while the weighted average term deposit rate of banks declined by 24 bps (up to January 2017). Combined with the sharp increase in low cost CASA deposits, the overall cost of borrowings declined, allowing banks to reduce their lending rates. The weighted average lending rate (WALR) of banks in respect of fresh rupee loans declined by 56 bps during November 2016-January 2017. During January 2017, 25 public sector banks reduced their 1-year MCLR in the range of 15 to 90 bps, while 17 private sector banks reduced it in the range of 10 to 148 bps. The 1-year median MCLR of SCBs declined by 55 bps during January 2017. During February 2017, six public sector banks lowered their 1-year MCLR in the range of 15 to 65 bps, while six private sector banks reduced in the range of 10 to 50 bps. During March 1-7, 2017, two private sector banks reduced their 1-year MCLR in the range of 5 bps and 20 bps.
The 1-year median MCLR has declined by a cumulative 70 bps since November 2016 even when the policy repo rate was not changed. This is significant, considering that the 1-year median MCLR declined by only 15 bps during the preceding seven months (April-October 2016) when the policy repo rate was reduced by 50 bps. The WALR on outstanding rupee loans declined by 8 bps during November 2016-January 2017 as against the decline of 11 bps during the preceding seven months (April – October 2016).
II.3 Non-Banking Financial Intermediaries
Demonetisation has impacted various financial intermediaries differently. As explained earlier, consolidated balance sheet of SCBs has expanded by about ₹ 6.7 trillion in the post-demonetisation period. Debt oriented mutual funds and insurance companies have also gained. Non-banking financial companies (NBFCs) and micro finance institutions (MFIs) were adversely affected, both in terms of disbursals and collection of dues. However, the situation with regard to most NBFCs has started to improve from late December 2016.
II.3.1 Mutual Funds
Reduction in deposit interest rates by banks after demonetisation enhanced the relative attractiveness of debt oriented mutual funds (MFs). As a result, there were net inflows in income/debt schemes during November 2016-January 2017 in contrast to net outflows during November 2015-January 2016. This was reflected in a sharp increase in the overall resources mobilised by mutual funds during November 2016-Janauary 2017 in contrast to outflows in the same period of last year (Table 10).
II.3.2 Life Insurance Companies
Premiums collected by life insurance companies more than doubled in November (Table 11). Premiums collected by Life Insurance Corporation of India (LIC) increased by more than 140 per cent (y-o-y) in November 2016 as compared with less than 50 per cent by private sector life insurance companies. About 85 per cent of the total collections by LIC in November 2016 were under the ‘single premium’ policies, which are paid in lump sum, unlike the non-single premium policies that can be paid monthly, quarterly or annually. LIC of India effected a downward revision in the annuity rates of its immediate annuity plan Jeevan Akshay VI purchased from 1st December 2016, which might have created a spurt in collections in the month of November 2016 for LIC of India. The impact, however, seemed to be a one-time jump with the collections tapering subsequently.
II.3.3 Non-Banking Financial Companies (NBFCs)
Loan disbursals by all categories of NBFCs declined significantly in November 2016 compared with the monthly average disbursals during April-October 2016, especially for micro finance companies (NBFC-MFIs) whose business is more cash intensive (Table 12a). NBFCs operating in semi-urban and rural areas rely more on cash and thus got affected. Fresh loan demand for large truck operators fell with lower freight business. Inability of borrowers to make down payments slowed consumer loans. The demand from real estate sector was anecdotally the worst affected as buyers expected prices to decline sharply. To sum up, demand for credit declined due to customers postponing decisions on account of uncertainty.
In contrast with loan growth, collections (i.e., repayments of loans due) of loan companies (LCs) during both November and December 2016 increased over the monthly average collections during April-October 2016. Although collections by asset finance companies (AFCs) declined in November, they increased in December 2016. Collections by NBFC-MFIs declined in both November and December vis-à-vis April-October 2016, but December figures were better than those of November 2016 (Table 12b). Consumer finance, which is mainly through post-dated cheques was less affected. Wholesale accounts which use online transfers suffered even less. Some customers of AFCs, who had failed to pay instalments during November 2016, may have paid them along with the December 2016 instalments switching to digital payments in December 2016 leading to an improvement in collections. Collections by HFCs, after marginal contraction in November, rebounded significantly in December 2016.
The growth of credit extended by banks to NBFCs also appeared to have been impacted due to demonetisation. Bank credit growth to NBFCs decelerated from 5.1 per cent on y-o-y basis in October 2016 to 1.3 per cent in November 2016, which further declined by 0.6 per cent in January 2017.
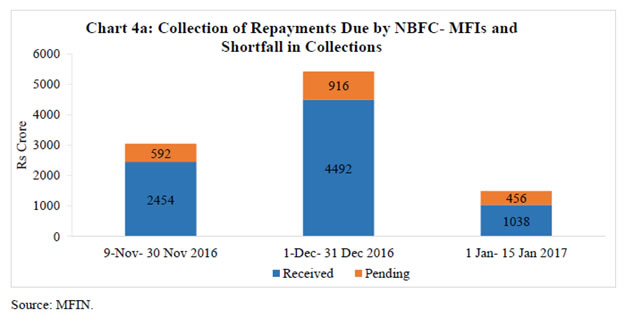
As regards the micro finance segment of NBFCs, demonetisation impacted NBFC-MFIs as their customers depend on cash transactions. Such customers often fall in the category of small farmers and unskilled labour. Microfinance institutions were reported to have faced problems in getting full repayment from clients in some pockets of the country because of currency shortage. In order to provide relief to this sector, the Reserve Bank in November 2016 provided an additional 60 days beyond what was applicable for the concerned regulated entities in this sector for recognition of a loan account as sub-standard. Subsequently, on December 28, 2016, the Reserve Bank again announced forbearance of 30 days (in addition to the 60 days provided earlier) for asset classification for dues payable between November 1 and December 31, 2016, the impact of which on NPAs would be known by the end of March 2017. Data provided by the MFIN7 suggest that pending repayments were still high in January 2017 (Chart 4a).
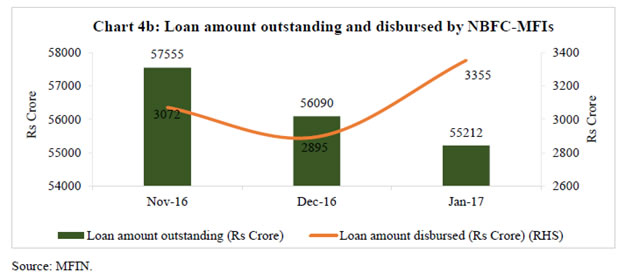
While total loan amount outstanding declined by 4.1 per cent between end-November and end-January 2017, loan amount disbursed increased by 9.2 per cent during the same period (Chart 4b).
The information sourced from Sa-Dhan indicates that cash collections, which initially witnessed significant reduction, improved subsequently, except for some pockets in the western region. The latest feedback received by MFIN from their member MFIs suggests that there has been some improvement in collections since late December 2016. While repayments are mostly made in cash, MFIs are striving to opt for different cashless ways for disbursements.
II.4 Jan Dhan Accounts
Post-demonetisation, 23.3 million new accounts were opened under the Pradhan Mantri Jan Dhan Yojana (PMJDY), bulk of which (80 per cent) were with public sector banks (Table 13). Of the new Jan Dhan accounts opened, 53.6 per cent were in urban areas and 46.4 per cent in rural areas.
Deposits under PMJDY accounts increased significantly post demonetisation. The total balance in PMJDY deposit accounts peaked at ₹ 746 billion as on December 7, 2016 from ₹ 456 billion as on November 9, 2016 – an increase of 63.6 per cent (Chart 5). As there were reports regarding the use of these accounts to convert black money into white, the Government issued a warning against the misuse of such accounts.
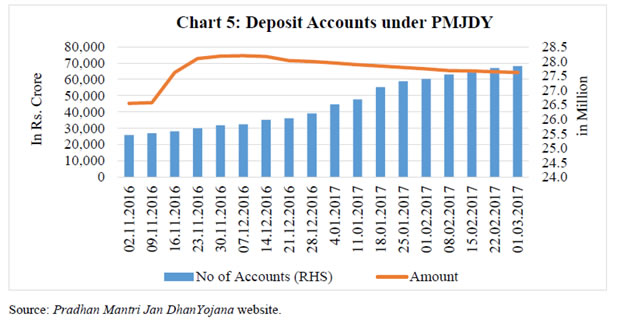
The Government also capped deposits into PMJDY accounts at ₹ 50,000 on November 15, 2016. Although deposits declined to ₹ 643 billion as on March 1, 2017, they were still higher by 41 per cent over the level of November 9, 2016. Jan Dhan accounts contributed 4.6 per cent in total accretion of aggregate deposits of SCBs in the post-demonetisation period (Table 14).
III. Financial Markets
Demonetisation impacted various segments of the financial markets in varying degrees. However, in most segments, the impact was transient. Surplus liquidity conditions post-demonetisation have imparted an easing bias to G-sec yields. Overnight call money market rates remained within the corridor but traded with a distinct softening bias. In sympathy with the overnight call rate, other short-term rates also eased. In the equity market, share prices relating to cash intensive sectors such as realty, consumer durables, auto and FMCG declined significantly in November and December, but most of these sectors recovered the lost ground subsequently. The impact on the foreign exchange market was transitory.
III.1 Money Market
Despite large surplus liquidity, active liquidity management by the Reserve Bank (see Section II) ensured that the weighted average call money rate (WACR) – the operating target of monetary policy – traded around the repo rate (during November 8 to November 25), but with a softening bias (23 bps on an average). With the announcement of the incremental CRR of 100 per cent on November 26, banks borrowed aggressively on November 28 (November 26 and 27 being holidays) from both the Reserve Bank and money markets to meet the additional reserve requirement. This pushed up the WACR above the repo rate on November 28. However, this impact was short-lived and the WACR started trading again with an easing bias (21 bps on an average) from December 1, reflecting the persisting surplus liquidity conditions (Chart 6).
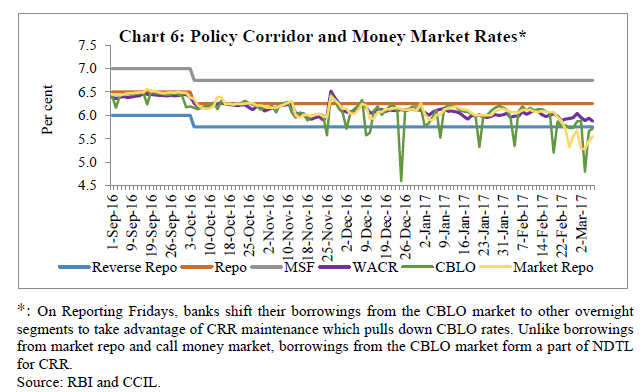
Other overnight money market rates have tracked the WACR (Table 15). In line with the overnight money market rates, other short-term rates also eased. Post demonetisation, 3-month CD and 91-day T-bill rates softened by about 22 and 45 basis points (bps) respectively, while the 3-month CP rate declined by 9 bps.
III.2 Government Securities Market
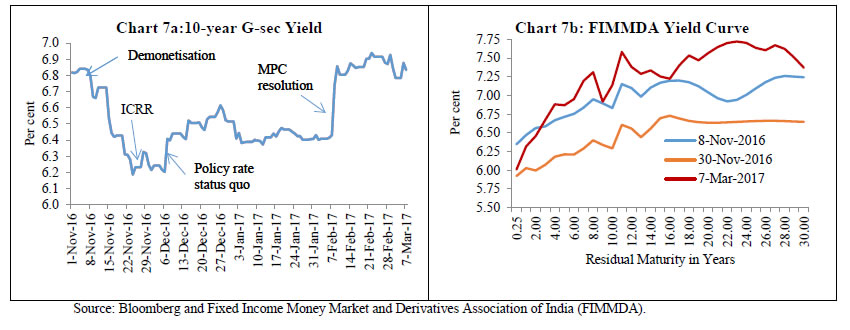
The 10-year gilt yield softened from 6.80 per cent (November 8, 2016) to as low as 6.18 per cent (November 24, 2016). It rose to 6.33 per cent on November 28 with the announcement of the incremental CRR effective November 26, which helped maintain integrity of the yield curve (Chart 7a). Following the MPC’s decision to pause on December 7, the 10-year benchmark yield hardened by 21 bps and traded in a range-bound manner but with a hardening bias up to end-December. This was also supported by global developments, including US monetary policy tightening and subsequent hardening of US yields driving FPI outflows from EMEs, including India, and higher crude prices. Between end-December 2016 and early February 2017, however, the benchmark yield traded with a softening bias on continuing surplus liquidity conditions and the reduction in the government borrowing programme for January-February 2017. Bond yields firmed up significantly over two successive days after the announcement of the change in the monetary policy stance from accommodative to neutral on February 8, 2017 by the Monetary Policy Committee (MPC). Yields have remained firm thereafter. The spread between 30-year and 10-year yields declined from 41 bps on November 8, 2016 to 35 bps on November 30 and further to 23 bps on March 7, 2017 (Chart 7b).
III.3 Equity Market
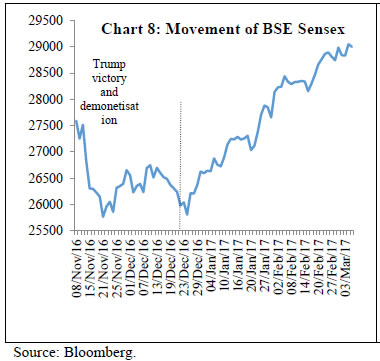
Demonetisation coincided with the US presidential election results announced on November 8, 2016. The victory of Donald Trump amplified concerns surrounding more protectionist trade policies in the US, on top of expectations of tightening of US monetary policy, and possibly looser US fiscal policy. Reflecting these developments, the Indian equity market plummeted, with the BSE Sensex declining by 3.5 percent (up to December 30, 2016) from its level on November 8, 2016 (Chart 8). Disappointing quarterly earnings results from some blue-chip companies also impacted the equity market. Since the US presidential election results were also announced on November 8, 2016, it would be difficult to disentangle the specific impact of the SBNs and the US Presidential election results on the Indian capital market.
Although the equity market was affected by both domestic and global factors, the impact of demonetisation alone can be gauged from the movement in indices of cash sensitive sectors such as FMCG, consumer durables, auto and realty vis-a-vis the overall index. As against the decline of 3.5 per cent in the BSE Sensex (from November 9 to December 30), the BSE realty index declined by 14.4 per cent, followed by consumer durables (-9.9 per cent), auto (-9.0 per cent) and FMCG (-5.3 per cent) indicating market expectation of a sharp fall in demand for these products, as they were disproportionately driven by cash transactions. However, the impact on sectoral indices was transitory as they have since recovered most of the lost ground. As against the overall increase of 8.9 per cent in the BSE Sensex between March 7, 2017 and December 30, 2016, the BSE consumer durables index increased by 23.0 per cent, followed by realty (18.8 per cent), FMCG (8.7 per cent) and auto (7.2 per cent) during this period. On the whole, while consumer durables, FMCG and realty indices are now higher than their pre-demonetisation levels, the auto sector is marginally lower (Table 16).
Equity portfolio flows cumulatively declined by US$ 3.9 billion during November 9-December 30, 2016. The overall foreign portfolio outflows were US$ 9.8 billion during this period. This may be on account of international developments also as the US presidential election results raised expectations of tightening of monetary policy by the US Fed. In this regard, it is significant that most of the EMEs also witnessed capital outflows during the same period. Beginning the second half of January 2017, net equity foreign portfolio flows have turned positive again.
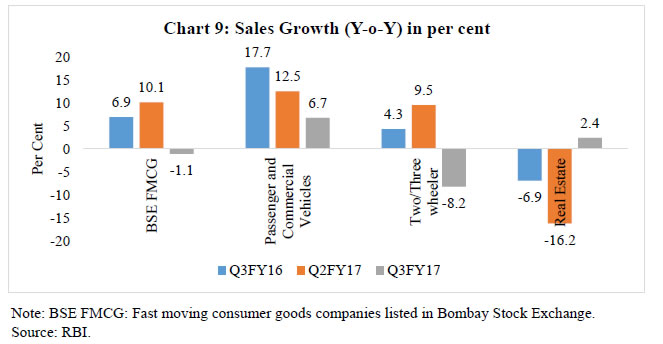
The equity market was buoyed by the encouraging corporate sector results for Q3. The results of the listed companies for Q3 of 2016-17 suggest that the corporate sector remained resilient as sales and net profits improved at an aggregate level as also for manufacturing companies (Table 17).
Within manufacturing, sales of cash intensive sectors such as FMCG and motor vehicle companies got impacted in Q3 vis-à-vis the previous quarter (Chart 9). However, the companies in the real estate sector registered positive sales growth in Q3 in contrast to the sharp contraction in the previous quarter.
The share prices of most of the large listed NBFCs also registered a significant decline between November 8, 2016 and December 30, 2016 mainly due to the cash intensive nature of their businesses and delayed repayments (Table 18). However, the share prices of most of such companies have recovered fully/partially after December 2016.
III.4 Foreign Exchange Market
The foreign exchange market has exhibited some volatility post-demonetisation, reflecting both global and domestic developments. Foreign portfolio investors (FPIs) made net sales of US$ 8.8 billion (November 9, 2016 to February 16, 2017) in a global retrenchment across EMEs as funds rebalanced their emerging market (EM) exposures after the US presidential elections and the Fed rate hike. The softening of G-sec yields following surplus liquidity immediately after demonetisation may also have encouraged some FPIs to sell government securities to book profits. The likely fall in quarterly earnings of cash intensive sectors such as auto and FMCG may have also led to a sell-off by FPIs, which led to some volatility in the foreign exchange market. However, equity portfolio flows have been positive at US$ 2.4 billion since January 17, 2017.
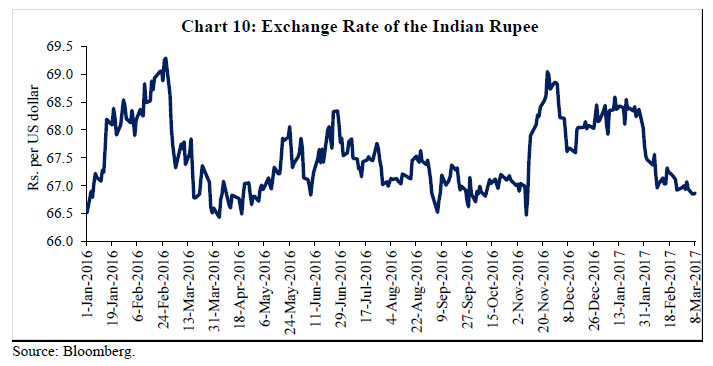
The Indian rupee, which depreciated by 2.6 per cent during November 8, 2016 to November 30, 2016 against the US dollar, appreciated in the first week of December 2016. Considering the factors mentioned above and the peak FCNR(B) deposit redemptions in November 2016, the exchange rate volatility remained contained. Thereafter, it exhibited some downward pressure amidst sustained foreign portfolio outflows especially after the US Fed’s policy rate hike and hawkish guidance, and increased demand for dollars from importers. Since February 2017, the Indian rupee has appreciated by 1.8 per cent mainly due to net equity inflows led by the policy announcements made in the Union Budget and the change in the monetary policy stance of the Reserve Bank from accommodative to neutral (Chart 10). Thus, the impact of demonetisation on the forex market appeared to have been transitory.
IV. External Sector
Demonetisation and the concomitant cash shortage impacted India’s external sector only moderately, but which was already facing a challenging external environment due to slowdown in global trade amidst rising support for protectionism in the US. Gold imports, which rose sharply in November 2016, moderated thereafter.
IV.1 Balance of Payments
IV.1.1 Merchandise Exports
According to the latest available estimates from the CPB World Trade monitor, the volume of world trade increased by 0.5 per cent (month-on-month, m-o-m) in December 2016 as compared with 2.6 per cent in November. Exports data for January 2017 available for some emerging market economies indicate an increase (year-on-year, y-o-y, growth in US$ terms) of 7.9 per cent for China, 15.8 per cent for Taiwan, 11.2 per cent for Korea, 5.7 per cent for Vietnam and 32.7 per cent for Brazil.
India’s export growth, after having accelerated in September-October 2016, slowed in November 2016 (2.4 per cent in US$ terms on a y-o-y basis) as shipments, especially from some labour-intensive sectors, were adversely affected by demonetisation. Export growth recovered in December 2016 and January 2017 to 5.5 per cent and 4.3 per cent, respectively. Two-thirds of export growth in January 2017 was fuelled by petroleum products, while growth in non-oil exports was 1.6 per cent. The Federation of Indian Export Organisations (FIEO) projects exports to be US$ 270 billion in 2016-17 (vis-à-vis its September estimate of US$ 280 billion).8
About 36 million micro, small and medium enterprises (MSMEs) contribute around 40 per cent of India’s exports and provide employment to over 80 million persons. Within the MSME sector, gems and jewellery, carpets, textile, leather, handlooms and handicrafts are highly labour intensive sectors and more dependent on cash for their working capital requirements. Contractual labour in both the wearing apparel and gems and jewellery sectors reportedly suffered as payments from employers became constrained.9 The cash shortage also adversely affected informal sources of finance.
Reflecting these factors, export shipments of gems and jewellery, readymade garments, meat and dairy products, and handicrafts and carpets either declined or recorded a lower growth in November 2016 as compared with October 2016. While sectors such as readymade garments and cotton yarn exhibited an increase in exports in January 2017, exports of sectors such as gems and jewellery, leather and leather products, and meat, dairy and poultry products contracted in January 2017 (Table 19).
The cotton sector – already impacted by low demand from China since 2014-15 – faced some domestic supply constraints after demonetisation. As farmers preferred to postpone their sales due to lack of cash, cotton arrivals dropped by 30 per cent in November (Indian Cotton Federation).10 Consequently, shipments of cotton bales also remained below order books in that month.11 About 70 per cent of India’s cotton exports are shipped during October-March every year. The industry expected an export of six million bales of cotton in the current cotton year (October 2016-September 2017), but these are now expected to be lower.
Exports of leather and leather products remained resilient in November 2016 as demand was probably met with stocks of raw material procured earlier. A quick survey by ASSOCHAM (December 19, 2016), however, indicated a sharp decline in arrivals of animal hide in major leather clusters – Agra, Kanpur and Kolkata. In view of constraints on availability of raw material as well as transportation and labour bottlenecks, about 60 out of 100 respondents indicated that they were no longer taking export orders, and this appeared to have been reflected in data for December 2016 and January 2017.
IV.1.2 Merchandise Imports
After a spurt in November, gold imports moderated in December 2016 and January 2017 (Section IV.2). As regards non-gold imports, demand for edible oils was expected to slow down as domestic consumption and offtake have weakened following demonetisation. The impact has been mainly through a fall in discretionary spending as evident from lower offtake from restaurants, hotels and small eateries and reduction in expenses on marriages and religious functions. Vegetable oil imports account for nearly 3 per cent of India’s imports. These imports declined by 12.7 per cent in December 2016, and increased by 6.1 per cent in January 2017.
IV.1.3 Exports and Imports of Services
As regards exports and imports of services, lead information from the authorised dealers through the Foreign Exchange Transactions Electronic Reporting System (FETERS) and other sources indicates:
- There was a strong growth in foreign tourist arrivals of 13.2 per cent (year-on-year) during November 2016 to January 2017.12 October to March is the peak season for Indian tourism industry.
- Receipts on account of transportation services remained muted in Q3 of 2016-17.
- Private transfers (particularly remittances for family maintenance) slowed, perhaps reflecting postponement by remitters as local family members might not have been able to encash instruments/withdraw immediately due to limits.
IV.1.4 Capital Flows
Foreign direct investment (FDI) flows remained buoyant in November and December 2016. Portfolio flows (debt and equity) declined sharply from November 2016 to mid-January 2017, reflecting largely global factors. They, however, turned positive since the last week of January (Section III). There was an outflow in non-resident Indian (NRI) deposits of around US$ 18.5 billion during October to December 2016. This was mainly on account of redemption of foreign currency non-resident (FCNR) deposits raised in 2013 under the swap schemes.13 Domestic deposit rates have softened even as the US Federal funds rate has increased. These developments may have some impact on non-resident deposit inflows. Loan agreements by domestic entities for external borrowings through the external commercial borrowings (ECBs) route moderated by 33 per cent (year-on-year) to US$ 5.1 billion during November 2016-January 2017.
Overall, for 2016-17, net capital flows are expected to be sufficient to finance the CAD. The medium-term impact of demonetisation on FDI is expected to be positive. In particular, FDI in financial services, especially digital payments technology and services, is expected to get a boost.
IV.2 Demand for Gold
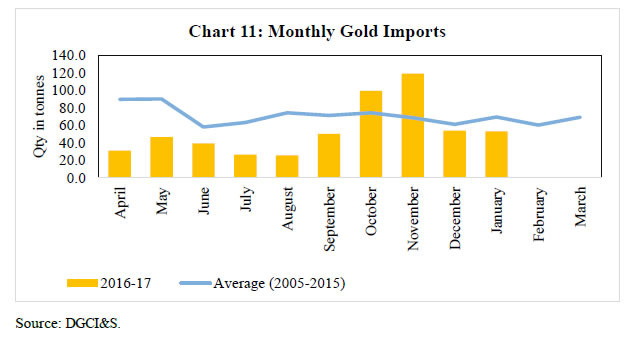
After demonetisation, domestic demand for gold (or gold items) spiked suddenly, with buyers reportedly willing to pay huge premiums to dispose of old currency notes with jewellers. Reflecting this development as well as the seasonal jump, the volume of gold imports surged in November, even above the elevated October level. Gold imports, however, declined sharply in December 2016 and January 2017 (Table 20). As around 80 per cent of the gems and jewellery purchases in India are made in cash, consumer demand was reported to have been impacted due to the cash shortage.14
India’s gold imports declined to 661 tonnes in the calendar year 2016 (from 1047 tonnes in 2015) (Table 21). Gold imports during 2016 were lower than the 10-year average (2005-06 to 2015-16) (Chart 11). Several domestic factors impacted demand for gold such as weak rural demand, destocking of earlier purchases, recycling of jewellery of households, increased regulations towards transparency and the possibility of some demand being partly met through smuggling.15 Besides, high and volatile international gold prices also appeared to have impacted gold demand.
V. Digital Modes of Payments
An upshot of demonetisation was that the digital modes of payments picked up sharply. After demonetisation, there has been a significant emphasis on digital modes of payment. The Government of India and the Reserve Bank have initiated a series of measures, some of which are temporary, to promote movement from cash to non-cash modes of transactions. They include, inter alia, (i) reduction in the merchant discount rate (MDR) and point of sale (POS) fees; (ii) monetary incentives in the form of discounts and prizes; (iii) service tax relief on MDR for small transactions; (iv) waiver of charges for small value transactions under Immediate Payment Service (IMPS), Unified Payment Interface (UPI) and Unstructured Supplementary Service Data (USSD) based *99# platform; (v) broadening Prepaid Payment Instrument (PPI) reach by enhancement of limits; (vi) introduction of a new category of PPIs; (vii) permitting banks to issue PPIs to a larger set of entities; and (viii) permitting National Payments Corporation of India (NPCI) to launch (a) the common app for UPI; and (b) National Electronic Toll Collection (NETC) system.
The government also announced that it would ensure that transactions fee/MDR charges associated with payment through digital means shall not be passed on to consumers (Annex C). These measures are encouraging migration of consumers from cash to digital modes of payments.
After the announcement of demonetisation, digital activity levels were low in the initial weeks as people were busy depositing/exchanging SBNs. However, in December 2016, digital payment activity increased alongside progressive remonetisation. The usage statistics show that the y-o-y growth for major modes of electronic payments was good in October 2016, mainly on account of festive season. The continuance of that high growth with a further pick up in some components from November to January 2017 (Table 22) was a positive fallout of demonetisation. However, the pace of growth moderated somewhat in February 2017. A description of select categories of electronic payments system is presented in Annex D.
| Table 22: Growth in Select Electronic Modes of Payments16 | ||||||
| (y-o-y growth in per cent) | ||||||
| Category | Oct-2016 | Nov-2016 | Dec-2016 | Jan-2017 | Feb-2017 | |
| NEFT | Volume | 16.2 | 23.3 | 39.0 | 38.0 | 34.5 |
| Value | 37.6 | 38.3 | 40.8 | 60.2 | 49.5 | |
| CTS | Volume | -1.1 | 23.0 | 58.4 | 52.7 | 20.2 |
| Value | 2.9 | 8.6 | 13.0 | 19.3 | 0.8 | |
| IMPS | Volume | 116.7 | 89.6 | 157.2 | 177.7 | 150.4 |
| Value | 150.7 | 135.9 | 186.6 | 196.7 | 184.2 | |
| NACH | Volume | 53.0 | 30.8 | 58.3 | 19.8 | -0.9 |
| Value | 89.8 | 76.3 | 116.7 | 22.8 | 54.2 | |
| Source: RBI Bulletins and Press Releases on Electronic Payment Systems – Representative Data | ||||||
The recent pick-up in digital payment activity is better reflected in the sequential growth in the months following demonetisation. The pattern of digital transactions in February 2017 over November 2016 shows that the growth rates surged in both value and volume terms compared with the corresponding period of last year for most electronic modes of payment, even as there was some decline in the use of digital payments after December 2016 (Table 23).
Of the various digital payment services that grew sharply post demonetisation, some require particular mention.
First, a sharp pickup is seen in UPI transactions, a flagship product of the NPCI, though on a low base. The number of transactions rose from about 0.3 million in November to 2.0 million in December and further to 4.2 million in January and February. The value of transactions increased 20 fold from ₹ 0.9 billion in November to about ₹ 19 billion in February. The average ticket size of transactions using UPI also increased from ₹ 3,150 to about ₹ 4,600 within the short window of three months, indicating some increase in confidence among the users. The UPI platform is operated through an app for money transfer between bank accounts using a smart phone in both on-line and off-line (at brick and mortar shops) modes. UPI provides ease to person-to-person as well as person-to-merchant transactions. Until recently, the front-end mobile app was provided by a few banks. However, with the introduction of Bharat Interface for Money (BHIM), there is now a front-end app, developed by NPCI, which will serve as a common app for any bank. Linked to a bank account at the back-end, BHIM allows sending and receiving money to/from other UPI accounts or addresses, and also allows remittances to users who do not have a UPI-based bank account.
| Table 23: Recent Growth in Digital Modes of Payments17 | |||||||
| Category | (Volume in million, Value in ₹ billion) | Change (%) | |||||
| Nov-16 | Dec-16 | Jan-17 | Feb-17 | Feb-17 over Nov-16 | Feb-16 over Nov-15 | ||
| NEFT | Volume | 123 | 166 | 164 | 148 | 20.4 | 10.4 |
| Value | 8808 | 11538 | 11355 | 10878 | 23.5 | 14.3 | |
| Average ticket size (₹ ) | 71583 | 69376 | 69159 | 73397 | 2.5 | 3.5 | |
| CTS | Volume | 87 | 130 | 118 | 100 | 15.3 | 18.0 |
| Value | 5419 | 6812 | 6618 | 5994 | 10.6 | 19.2 | |
| Average ticket size (₹ ) | 62236 | 52395 | 55873 | 59677 | -4.1 | 1.1 | |
| IMPS | Volume | 36 | 53 | 62 | 60 | 65.2 | 25.1 |
| Value | 325 | 432 | 491 | 482 | 48.5 | 23.2 | |
| Average ticket size (₹ ) | 8982 | 8183 | 7870 | 8071 | -10.1 | -1.4 | |
| UPI | Volume | 0.3 | 2.0 | 4.2 | 4.2 | 1346.1 | – |
| Value | 0.9 | 7.0 | 16.6 | 19.0 | 2001.2 | – | |
| Average ticket size (₹ ) | 3150 | 3565 | 3995 | 4577 | 45.3 | – | |
| USSD | Volume | 0.007 | 0.102 | 0.314 | 0.225 | 3091.9 | – |
| Value | 0.007 | 0.104 | 0.382 | 0.357 | 4789.4 | – | |
| Average ticket size (₹ ) | 1037 | 1015 | 1215 | 1589 | 53.2 | – | |
| Debit and Credit Cards at POS & | Volume | 206 | 311 | 266 | 212 | 3.3 | 3.9 |
| Value | 352 | 522 | 481 | 391 | 11.1 | -5.6 | |
| Average ticket size (₹ ) | 1714 | 1679 | 1812 | 1844 | 7.5 | -9.2 | |
| PPI # | Volume | 59 | 88 | 87 | 78 | 32.8 | 4.3 |
| Value | 13 | 21 | 21 | 19 | 41.9 | 15.2 | |
| Average ticket size (₹ ) | 224 | 242 | 241 | 239 | 6.8 | 10.4 | |
| &: Card transactions of four banks. -: Comparative data not available #: Post Paid Instruments issued by 8 non-bank issuers for goods and services transactions only. Source: For FY16, full data from DBIE, RBI; For FY17, RBI Daily Press Releases on Electronic Payment Systems – Representative Data. | |||||||
Second, an impressive pick-up in growth for two straight months in December and January – in both value and volume terms, as also in the average ticket size – was observed in the NPCI’s *99# service, which works on an USSD channel. While the volumes moderated slightly in February, the average ticket size continued to grow. This service caters to real time remittances for low value transactions, particularly of the under-banked sections of society, and facilitates their integration with mainstream banking services. The USSD service brings together diverse ecosystem partners such as banks and telecom service providers and allows customers to access financial services by dialling *99# from their mobile registered with the bank. The service works across all GSM service providers and all types of handsets – smart phones and feature phones.
Third, the spurt in digital payment activity in PPIs has also been noteworthy, with the value of transactions increasing from ₹ 13 billion to ₹ 19 billion, an increase of 42 per cent in three months. However, as remonetisation progressed, there was some decline in m-o-m growth in PPI transactions in January and February 2017 compared with December 2016. PPIs facilitate purchase of goods and services, including funds transfer, against the value stored on such instruments. Money can be loaded on PPIs by cash, or by debit to a bank account, or by credit card. PPIs are issued as smart cards, magnetic stripe cards, internet accounts, internet wallets, mobile accounts, mobile wallets, and paper vouchers. The post-demonetisation spurt in activity among the major payment wallet companies such as Paytm, Free charge, Mobikwik, SBI’s Buddy, and HDFC’s Chillr has been phenomenal. Both app downloads and merchant acquisitions have happened at a fast pace.
Fourth, debit and credit card payments at PoS, the familiar and time tested mode of digital payments, also recorded a sharp pick-up in December but the growth moderated in January and further in February with progressive remonetisation.
The catalytic push from demonetisation hastened migration towards digital payments in November and December 2016. However, ease in availability of cash by progressive remonetisation impacted the pace of growth of digitalisation in February 2017. Further efforts are essential to enhance the use of digital payment going forward such as: (i) continued efforts to incentivise digitalisation; (ii) removing roadblocks in penetration of payment technology; (iii) handholding of new users to bring in behavioural shift; and (iv) providing an environment for development of a robust and easily scalable payment ecosystem that benefits from the advancements in technology. This will facilitate adoption of digital payments on a sustained basis and help in substantial savings for the country in terms of reduction in cost of cash in the system18; and an increase in accountability and tractability of transactions, thereby circumscribing tax avoidance.
While it is important that efforts be made for increasing acceptance of digital payments, it is equally vital to ensure that the digital payments are safe and secure. It has been the constant endeavour of the Reserve Bank to enhance security features of currency notes to maintain confidence in India’s paper currency. Similarly, there is a need to constantly review and ramp up security features of digital payments to maintain and enhance trust of its users, especially, given the low levels of literacy in India. In this context, the Report of the Committee on Digital Payments (Chairman: Shri Ratan Watal) submitted in December 2016 has also underlined, inter alia, the need for enhancing the resilience of the Indian payments and settlement systems; and strengthening the consumer protection framework in digital payments.
VI. Summing Up
Overall, the assessment is that the impact of demonetisation on the real economy has been transient, given the information available so far. The analysis in this paper suggests that demonetisation impacted various sectors of the economy; however, the adverse impact, in general, was short-lived as it was felt mainly in November and December 2016. The impact moderated significantly in January and dissipated by and large by mid-February 2017, reflecting an accelerated pace of remonetisation.
The impact on GVA growth, albeit modest, was felt in Q3 of 2016-17. The organised sector remained largely resilient. The latest CSO estimates suggest that the impact of demonetisation on GVA growth in Q3 of 2016-17 was felt mostly in real estate and construction, but because of stronger growth in agriculture, manufacturing, electricity, and mining, the overall impact on GVA growth was modest. With remonetisation progressing at a fast pace, the adverse impact is expected to have reversed from the latter part of Q4 of 2016-17. GVA growth is estimated to recover significantly in 2017-18.
The 240 bps decline in food inflation during November 2016 to January 2017 was the combined effect of record pulses production, large winter arrivals of vegetables and some fire sales due to decline in demand following cash squeeze. However, inflation excluding vegetables moderated only marginally. Also, inflation excluding food and fuel remained sticky. The headline inflation outlook in the near term will hinge on how food inflation evolves.
With the return of SBNs, currency in circulation declined and deposits with banks surged. This expanded the balance sheet of banks and created large surplus liquidity in the system, which was managed by the RBI mostly through a mix of reverse repo and MSS securities. Reflecting this, the share of ‘investment in government securities’ on the asset side of banks’ balance sheet increased significantly. Large surplus liquidity led to a significant improvement in monetary policy transmission as reflected in a significant decline in deposit and lending interest rates. The sharp increase in low cost CASA deposits by banks is expected to have increased banks’ net interest income. However, this will need to be adjusted against the cost of managing the process of demonetisation. As regards other segments of the financial sector, some NBFCs, especially MFIs, were adversely affected, in terms of disbursals and collection of repayments. However, the situation for most NBFCs began to improve from late December 2016. Jan Dhan accounts increased by 23.3 million post demonetisation, while deposits under Jan Dhan accounts increased by ₹ 187 billion (41 per cent).
The impact of demonetisation on the various segments of the financial market has varied. Overnight call money market rate remained within the policy corridor, but with a softening bias due to surplus liquidity at banks. After initial softening, G-sec yields increased significantly on two occasions, i.e., after the announcement of application of incremental cash reserve ratio (ICRR) and the status quo in monetary policy in December 2016. Thereafter, yields have moved in either direction on account of both domestic and external factors, including the change in monetary policy stance in February 2017, which was largely not expected by market participants.
Reflecting the expected slowdown in sales and earnings, share prices of cash intensive sectors such as automobiles, FMCG, consumer durables and real estate declined sharply in November-December 2016. Most of these sectors have more than recovered the lost ground subsequently. In fact, the consumer durable sector outperformed the overall increase in the stock market post-demonetisation. The impact on the forex market was transitory.
Demonetisation has impacted some segments of the export sector such as readymade garments, and gems and jewellery. The impact, however, was transitory. Imports of gold increased sharply in November, but moderated in December.
There has been a significant improvement in the use of digital modes of payments post demonetisation, although their base is still small.
Overall, demonetisation has had some negative macroeconomic impact, which, however, has been transient as remonetisation has moved at an accelerated pace in last twelve weeks. More importantly, demonetisation is expected to have a positive impact over the medium to long-term. In particular, there is expected to be greater formalisation of the economy with increased use of digital payments. The reduced use of cash will also lead to greater intermediation by the formal financial sector of the economy, which should, inter alia, help improve monetary transmission.
Given the partial information that is available post demonetisation so far, the analysis, especially of growth, is only preliminary in nature. It should, therefore, be possible to make an analysis in greater detail as more data becomes available in the coming months.
1 Government of India (2016), “Medium Term Recommendations to Strengthen Payments Ecosystem”, Report of the Committee on Digital Payments (Chairman: Shri Ratan Watal), New Delhi, December.
2 The Reserve Bank communicates its assessment of the growth outlook in terms of GVA because of the relatively robust nature of compilation of GVA by the Central Statistics Office (CSO) in comparison with gross domestic product (GDP). There is greater clarity on indicators that the CSO uses for estimating different components of GVA. Also, mostly production/supply side indicators are used for estimating expenditure side of GDP. However, it is noteworthy that GDP is the headline indicator of economic activity that is used almost universally.
3 Knight Frank half yearly report “India Real Estate Residential and office: July – December 2016”, http://www.knightfrank.co.in/
4 Different methodologies are used to revise and update RBI’s GVA growth projections. Short-term (two quarters ahead) projections are based on recent trends in hard and soft data. For such projections, a combination of structural single equation models and time series models for specific major components of GVA/specific lead indicators of GVA are used. Overall annual GVA growth is projected at the beginning of the year using broad macroeconomic explanatory variables under baseline assumptions (like world output growth, prices of Indian oil basket, fiscal deficit, monsoon conditions, exchange rate, etc). Both top-down (aggregate) as well as bottom-up (dis-aggregated) approaches are used. In the bottom-up approach, different components of GVA are projected first and then aggregated using relative weights. Projections for more than two quarters ahead are obtained from structural macro models.
5 A change in CPI year-on-year inflation between any two months is the difference of the current month-on-month change in the price index (momentum) and the month-on-month change in the price index 12 months earlier (base effect).
6 The market stabilisation scheme (MSS) scheme was launched in April 2004 to strengthen the RBI’s ability to maintain the stability in foreign exchange market and enable to conduct monetary policy in accordance with its stated objective. The ceiling on the amount of securities issued under the MSS is mutually agreed upon between the Government and the Reserve Bank from time to time by way of a Memorandum of Understanding (MoU) under the MSS. The government bills/bonds issued by way of auction under the MSS have all the attributes of the existing treasury bills and dated securities. The amount of bills and securities issued for the purpose of MSS is matched by an equivalent cash balance held by the Government with the Reserve Bank, thus, having only a marginal impact on the revenue and fiscal deficits of the Government to the extent of interest payment on bills/securities outstanding under the MSS. The cash management bills (CMBs) issued under the MSS are non-standard discounted instruments, generally issued by the Government to meet the temporary mismatches in their cash flows. CMBs have the generic character of Treasury Bills but are issued for maturities of less than 91 days. Hence, they can be issued to absorb excess liquidity during the period of large surplus conditions, as has been the case after demonetisation.
7 MFIN is the Self-Regulatory Organisation for NBFCs-MFIs. The analysis is based on 52 NBFC-MFIs and 4 MFIs.
8 FIEO’s Press Release on Trade Data for January 2017.
9 “40% layoff of contract workers in Noida units in 40 days of demonetisation”, Times of India, December 20, 2016.
10 “New cotton arrivals this season affected by demonetisation”, Yarns and Fibers News Bureau, December 3, 2016.
11 According to an industry estimate, cotton exporters booked orders of about two million bales for November 2016 to January 2017, but a significant chunk of orders might be delayed or cancelled.
12 Ministry of Tourism, Government of India
13In order to manage the volatility in the foreign exchange market in 2013 arising from the “taper talk”, the Reserve Bank, in September 2013, allowed banks to swap the fresh FCNR (B) dollar funds mobilised for a minimum tenor of three years with the Reserve Bank. These deposits began maturing from September 2016 onwards.
14“Modi’s demonetisation to hit real estate, jewellery sectors hardest”, Hindustan Times, November 18, 2016.
15 “Directorate of Revenue Intelligence (DRI) busts a major gold smuggling racket involving smuggling of around 7000 Kilograms of gold worth more than ₹ 2000 crore in last two and half years”, Press Information Bureau, Government of India, September 19, 2016.
16 Description of the categories is provided in Annex D.
17 Description of the categories is provided in Annex D.
18 According to the report Accelerating the Growth of Digital Payments in India: A Fiver Year Outlook by Visa (October 2016), the cost of cash is estimated at 1.7 per cent of GDP. The report says that India can save up to ₹ 70,000 crore in the next five years by taking measures to reduce cash handling by widening digital transactions base.
Annex Table 1: Demonetisation – Measures to Mitigate Hardships
Calibrated Adjustment of Limits for Exchange of Specified Bank Notes (SBNs)
- The exchange facility of specified bank notes (SBNs) at banks, which was initially allowed up to ₹ 4,000, was increased to ₹ 4,500. It was reduced to ₹ 2,000 (effective November 17, 2016). This facility was subsequently discontinued effective November 25, 2016 at banks, but was available at RBI counters up to December 30, 2016.
Withdrawal Limit from Automated Teller Machines (ATMs)
- The limit for cash withdrawal from ATMs, which was initially set at ₹ 2000 per day, was enhanced to ₹ 2500 per day and further to ₹4500 and ₹10,000 and was withdrawn from February 1, 2017.
Gradual Relaxation of Limits on Withdrawal from Bank Accounts
- The limit of withdrawal from saving account, which was initially stipulated at ₹ 20,000 per week, was revised to ₹ 24,000 and further to ₹ 50,000 per week (effective February 20, 2017). Effective March 13, 2017, there will be no limit on cash withdrawals from savings accounts.
- Current account withdrawal of ₹ 50,000 per week was enhanced to ₹ 1,00,000 per week effective January 16, 2017. Limit on cash withdrawals from current accounts was removed effective January 30, 2017.
- Cash withdrawals from the bank deposit accounts up to ₹ 2,50,000 were allowed from November 21, 2016 to meet wedding related expenses.
Deposit of SBNs
- Deposits of SBNs in bank accounts were permitted up to December 30, 2016.
- The facility for exchange of SBNs for the residents, who could not avail the facility from November 9 to December 30, 2016 on account of their absence from India during the aforementioned period, was made available at the RBI up to March 31, 2017 and for non-resident Indian citizens up to June 30, 2017.
Other Measures
- Banks were advised to waive ATM charges on withdrawals between November 10 and December 30, 2016.
- The limit for cash withdrawal at POS (for debit cards and open system prepaid cards issued by banks in India) was made uniform at ₹ 2000/- per day across all centres for all merchant establishments enabled for this facility and customer charges were not to be levied on such transactions from November 18, 2016 to December 30, 2016.
Annex A
| CSO’s Methodology to Estimate GVA of Unincorporated Manufacturing for the Base Year 2011-12: Effective Labour Input (LI) method [GVA = Effective LI x GVA per Effective Worker (GVAPEW)] | ||||
| SL. No. | Activity | Effective LI (Number) Base Year | Effective GVAPEW (Rupees) Base Year | Indicator for GVA estimation of the CSO (Quarterly /Annual) |
| 1 | Cotton ginning, cleaning and baling | 36743 | 99752 | Use IIP data until annual survey of industries (ASI) details are available with a lag of more than one year. |
| 2 | Production, processing and preservation of meat, fish, fruit vegetables, oils and fats | 497592 | 193866 | |
| 3 | Manufacture of dairy product | 115027 | 130753 | |
| 4 | Manufacture of grain mill products, etc. and animal feeds | 1035359 | 132323 | |
| 5 | Manufacture of other food products | 1411621 | 91511 | |
| 6 | Manufacture of beverages | 139125 | 114838 | |
| 7 | Manufacture of tobacco products | 1246466 | 65662 | |
| 8 | Spinning, weaving and finishing of textile+ Other textiles+ Knitted and crocheted fabrics and articles | 4747232 | 105886 | |
| 9 | Wearing apparel, except fur apparel and tailoring | 1169420 | 91728 | |
| 10 | Dressing and dyeing of fur; manufacture of articles of fur and tanning and dressing of leather; manufacture of luggage, handbags, saddlery, harness and footwear | 930792 | 104729 | |
| 11 | Manufacture of wood and of products of wood and cork, except furniture; manufacture of articles of straw and plating materials | 1738745 | 112971 | |
| 12 | Manufacture of furniture | 1316920 | 135545 | |
| 13 | Manufacture of Paper And Paper Products and publishing, printing and reproduction of recorded media | 870685 | 139744 | |
| 14 | Manufacture of coke, refined petroleum products and nuclear fuel and rubber and plastic products | 544142 | 108649 | |
| 15 | Manufacture of chemical and chemical products | 824971 | 89253 | |
| 16 | Manufacture of other non-metallic mineral products | 3926903 | 74233 | |
| 17 | Manufacture of basic iron & steel+ casting of iron and steel | 497674 | 170256 | |
| 18 | Manufacture of basic precious and non-ferrous metals+ Casting of non-ferrous metals | 69254 | 88923 | |
| 19 | Recycling of metal waste and scrap+ non-metal waste and scrap | 368141 | 87457 | |
| 20 | Manufacture of fabricated metal products, except machinery and equipment | 2071843 | 115431 | |
| 21 | Manufacture of machinery and equipment + office, accounting and computing machinery | 639241 | 125067 | |
| 22 | Electrical machinery and apparatus + radio, television and communication equipment and apparatus | 663128 | 113192 | |
| 23 | Manufacture of medical, precision and optical instruments, watches and clocks+ Manufacturing | 2392901 | 80872 | |
| 24 | Manufacture of motor vehicles, trailers and semi-trailers+ manufacture of other transport equipment | 446654 | 143210 | |
| Source: CSO | ||||
Annex B
| CSO’s Methodology for Unincorporated Non-financial Services GVA for the Base Year 2011-12 using LI method [GVA = Effective LI x GVA per Effective Worker (GVAPEW)] | ||||||
| SL. No. | Compilation Category | LI (Number) Base Year | GVAPEW (Rupees) Base Year | Indicators for GVA estimation of the CSO | ||
| Rural | Urban | Rural (Est.) | Urban (DE) | |||
| 1 | Maintenance and repair of motor vehicles and motor cycles | 727422 | 1688196 | 73559 | 90982 | Motor vehicles Sales |
| 2 | Sale of motor vehicles | 227743 | 669317 | 357360 | 218259 | Total sales tax growth |
| 3 | Whole sale trade except of motor vehicles | 1738747 | 3678356 | 96490 | 191436 | Total sales tax growth |
| 4 | Repair of personal and household goods | 1492616 | 1471320 | 45926 | 71139 | Service tax growth |
| 5 | Retail trade (except motor vehicles) | 17682870 | 19842156 | 101884 | 191015 | Total sales tax growth |
| 6 | Hotel & Restaurants | 2979529 | 4908952 | 69283 | 104105 | Corporate Growth |
| 7 | Other non-scheduled passenger land transport | 1197822 | 746105 | 72871 | 49942 | Growth in registered vehicles |
| 8 | Freight transport other than by motor vehicles | 632143 | 511749 | 86216 | 71929 | Growth in registered vehicles |
| 9 | Other communication (cable operator) | 53798 | 193699 | 32130 | 275232 | Service tax growth |
| Source: CSO | ||||||
Annex C
Recent Policy Measures for Promoting Digital Payments
I. Government of India
In the aftermath of the cancellation of the legal tender character of old ₹ 500 and ₹ 1,000 notes, there has been a surge in digital transactions through use of credit/debit cards and mobile phone applications/e-wallets etc. To further accelerate this process, the Central Government announced on December 8, 2016, the package of incentives and measures for promotion of digital and cashless economy in the country as reproduced below:
(http://pib.nic.in/newsite/PrintRelease.aspx?relid=155137)
- The Central Government Petroleum PSUs shall give incentive by offering a discount at the rate of 0.75% of the sale price to consumers on purchase of petrol/diesel if payment is made through digital means.
- To expand digital payment infrastructure in rural areas, the Central Government through NABARD will extend financial support to eligible banks for deployment of 2 POS devices each in 1 lakh villages with population of less than 10,000. These POS machines are intended to be deployed at primary cooperative societies/milk societies/agricultural input dealers to facilitate agri-related transactions through digital means.
- The Central Government through NABARD will also support Rural Regional Banks and Cooperative Banks to issue “RupayKisan Cards” to 4.32 crore Kisan Credit Card holders to enable them to make digital transactions at POS machines/Micro ATMs/ATMs.
- Railway through its sub urban railway network shall provide incentive by way of discount upto 0.5% to customers for monthly or seasonal tickets from January 1, 2017, if payment is made through digital means.
- All railway passengers buying online ticket shall be given free accidental insurance cover of upto ₹ 10 lakh.
- For paid services e.g. catering, accommodation, retiring rooms etc. being offered by railways through its affiliated entities/corporations to the passengers, it will provide a discount of 5% for payment of these services through digital means.
- Public sector insurance companies will provide incentive, by way of discount or credit, upto 10% of the premium in general insurance policies and 8% in new life policies of Life Insurance Corporation sold through the customer portals, in case payment is made through digital means.
- The Central Government Departments and Central Public Sector Undertakings will ensure that transactions fee/MDR charges associated with payment through digital means shall not be passed on to the consumers and all such expenses shall be borne by them. State Governments are being advised that the State Governments and its organizations should also consider to absorb the transaction fee/MDR charges related to digital payment to them and consumer should not be asked to bear it.
- Public sector banks are advised that merchant should not be required to pay more than ₹ 100 per month as monthly rental for PoS terminals/Micro ATMs/mobile POS from the merchants to bring small merchant on board the digital payment eco system.
- No service tax will be charged on digital transaction charges/MDR for transactions upto ₹ 2000 per transaction.
- For the payment of toll at Toll Plazas on National Highways using radio-frequency identification technology (RFID) card/Fast Tags, a discount of 10% will be available to users in the year 2016-17.
NITI Aayog announced the schemes Lucky Grahak Yojana and the Digi-धन Vyapar Yojana to give cash awards to consumers and merchants who utilise digital payment instruments for personal consumption expenditures on December 15, 2017. The scheme became operational with the first draw on 25th December, 2016 and will end with a Mega Draw on 14th April 2017. The scheme is focused on small transactions (entered into by common people) within the range of ₹ 50 and ₹ 3000.
(http://pib.nic.in/newsite/PrintRelease.aspx?relid=155418)
- Lucky Grahak Yojana [Consumers]: (i) Daily reward of ₹ 1000 to be given to 15,000 lucky Consumers for a period of 100 days; (ii) Weekly prizes worth ₹ 1 lakh, ₹ 10,000 and ₹ 5000 for Consumers who use the alternate modes of digital Payments such as UPI, USSD, Aadhar Enabled Payment System (AEPS) and RuPay Cards.
- Digi-धन Vyapar Yojana [Merchants]: (i) Prizes for Merchants for all digital transactions conducted at Merchant establishments; (ii) Weekly prizes worth ₹ 50,000, ₹ 5,000 and ₹ 2,500.
- Mega Draw on 14th of April: (i) 3 Mega Prizes for consumers worth ₹ 1 crore, 50 lakh, 25 lakh for digital transactions between 8th November, 2016 to 13th April; (ii) 3 Mega Prizes for merchants worth ₹ 50 lakhs, 25 lakh, 12 lakh for digital transactions between 8th November, 2016 to 13th April, 2017 to be announced on 14th.
II. Government of India –Budget 2017-18 Proposals
Main proposals made in the Union Budget, 2017-18 are reproduced below.
http://indiabudget.nic.in/ub2017-18/bs/bs.docx
- At present, 8% of their turnover is counted as presumptive income for small and medium tax payers whose turnover is up to ₹ 2 crore. There is a proposal to make this 6% in respect of turnover which is received by non-cash means. This benefit will be applicable for transactions undertaken in the current year also.
- There is a proposal to limit the cash expenditure allowable as deduction, both for revenue as well as capital expenditure, to ₹ 10,000. Similarly, the limit of cash donation which can be received by a charitable trust is being reduced from ₹ 10,000/- to ₹ 2000/-.
- The Special Investigation Team (SIT) set up by the Government for black money has suggested that no transaction above ₹ 3 lakh should be permitted in cash. The Government has decided to accept this proposal. Suitable amendment to the Income-tax Act has been proposed in the Finance Bill for enforcing this decision.
- To promote cashless transactions, there is a proposal to exempt BCD, Excise/CV duty and SAD on miniaturised POS card reader for m-POS, micro ATM standards version 1.5.1, Finger Print Readers/Scanners and Iris Scanners. Simultaneously, I also propose to exempt parts and components for manufacture of such devices, so as to encourage domestic manufacturing of these devices.
III. Reserve Bank of India
The measure undertaken by the Reserve Bank also detailed below.
a) Enhancement in the limit of semi-closed Prepaid Payment Instrument (PPI) with minimum details from ₹ 10,000/- to ₹ 20,000.
b) Introduction of a new category of PPI for small merchants on a self-declaration basis with maximum value of ₹ 20,000/- at any point of time.
c) Extending the permission given to banks to issue prepaid instruments to a larger set of entities/employers such as unlisted corporates/partnership firms/sole proprietorship/public organizations such as municipal corporations, urban local bodies (employers) for onward issuance to their staff/employees/contract workers. Earlier this was permitted only for corporates listed on stock exchanges.
d) Rationalisation of merchant discount rate (MDR) for transactions up to ₹ 2000/- (special measure) from January 1, 2017 to March 31, 2017.
e) Customer charges waived on Immediate Payment Service (IMPS), Unified Payment Interface (UPI) and USSD-based *99# platform transactions up to ₹ 1000/- from January 1, 2017 to March 31, 2017.
f) In-principle approval given to National Payments Corporation of India (NPCI) for launching the Common App for UPI (BHIM App), design changes in USSD *99# and Common App for enabling Aadhaar-based merchant payments (Aadhaar Pay).
g) In-principle approval given to NPCI for launching the Pilot of National Electronic Toll Collection (NETC) system for facilitating electrification of toll payments.
h) Rationalisation of Merchant Discount Rate (MDR) – draft circular issued for public comments on February 16, 2017.
i) Supportive measures:
- All authorised card networks have been advised to standardise the quick response (QR) code so that inter-operability of transactions using this mechanism is possible. This inter-operable QR code (Bharat QR) was launched on February 20, 2017.
- All authorised entities/banks issuing PPIs in the country have been advised to carry out a special audit by the empanelled auditors of CERT-IN on a priority basis and take immediate steps thereafter to comply with the findings of the audit report.
Annex D
Glossary
1. National electronic funds transfer (NEFT) is a nation-wide payment system facilitating one-to-one funds transfer. Under this Scheme, individuals, firms and corporates can electronically transfer funds from any bank branch to any individual, firm or corporate having an account with any other bank branch in the country participating in the Scheme. Under NEFT, the transactions are processed and settled in batches. There is no limit – either minimum or maximum – on the amount of funds that could be transferred using NEFT. However, for cash-based remittances, the maximum amount per transaction is limited to ₹ 50,000. https://rbi.org.in/Scripts/FAQView.aspx?Id=60.
2. Immediate Payment Service (IMPS) offers an instant, 24X7, interbank electronic fund transfer service through mobile phones. IMPS transfers money instantly within banks across India through mobile, internet and ATMs. This facility is provided by NPCI through its existing NFS switch.http://www.npci.org.in/documents/IMPS_FAQs.pdf.
3. Cheque Truncation System (CTS) is the process that obviates the need to move the physical instruments across bank branches. This reduces the time required for their collection and brings elegance to the entire activity of cheque processing.https://rbi.org.in/Scripts/FAQView.aspx?Id=63.
4. National Automated Clearing House (NACH) implemented by NPCI is a web based solution for making bulk transactions towards distribution of subsidies, dividends, interest, salary, pension etc. and also for bulk transactions towards collection of payments pertaining to telephone, electricity, water, loans, investments in mutual funds, insurance premium etc.http://www.npci.org.in/clearingBackground.aspx.
5. Unified Payments Interface (UPI) is a system that, through a universal application for transaction, connects multiple bank accounts into a single mobile application (of any participating bank) for immediate money transfer through mobile device round the clock 24×7 and 365 days. It uses a single mobile application for accessing different bank accounts. Recently NPCI has launched a front-end app called BHIM that can be downloaded on mobiles to use UPI for fund transfer. http://www.npci.org.in/UPI_Background.aspx.
6. Unstructured Supplementary Service Data (USSD) service of NPCI caters to the need for immediate low value remittances. The USSD service brings together diverse ecosystem partners such as banks & telecom service providers and allows customers to access financial services by dialling *99# from their mobile registered with the bank. The service works across all GSM service providers all types of handsets – smart phones and feature phones. http://www.npci.org.in/documents/FAQs-NUUP.pdf.
Abbreviations
| AFCs | Asset Finance Companies |
| ASSOCHAM | The Associated Chamber of Commerce of India |
| ATM | Automated Teller Machine |
| ASI | Annual Survey of Industries |
| BHIM | Bharat Interface for Money |
| bps | Basis Points |
| BSE | Bombay Stock Exchange |
| CAD | Current Account Deficit |
| CAS | Central Accounts Section |
| CASA | Current Account and Saving Account |
| CBLO | Collateralised Borrowing and Lending Obligation |
| CCIL | Clearing Corporation of India Limited |
| CD | Certificate of Deposit |
| CIC | Currency in Circulation |
| CMBs | Cash Management Bills |
| CMIE | Centre for Monitoring Indian Economy |
| CPI | Consumer Price Index |
| CRR | Cash Reserve Ratio |
| CSO | Central Statistics Office |
| CTS | Cheque Truncation System |
| DBIE | Database on Indian Economy |
| DGCI&S | Directorate General of Commercial Intelligence and Statistics |
| DRI | Directorate of Revenue Intelligence |
| DISCOMs | Distribution Companies |
| ECB | External Commercial Borrowing |
| EM | Emerging Market |
| EMEs | Emerging Market Economies |
| FCNR | Foreign Currency Non-Resident |
| FDI | Foreign Direct Investment |
| FETERS | Foreign Exchange Transactions Electronic Reporting System |
| FIEO | Federation of Indian Export Organisations |
| FIMMDA | Fixed Income Money Market and Derivatives Association of India |
| FMCG | Fast Moving Consumer Goods |
| FPIs | Foreign Portfolio Investors |
| FR | Fixed Rate |
| FY | Financial Year |
| GDP | Gross Domestic Product |
| G-Sec | Government Security |
| GST | Goods and Services Tax |
| GVA | Gross Value Added |
| GVAPEW | Gross Value Added per Effective Worker |
| H1 | First Half of the Year |
| H2 | Second Half of the Year |
| HFCs | Housing Finance Companies |
| ICRR | Incremental Cash Reserve Ratio |
| IIP | Index of Industrial Production |
| IMPS | Immediate Payment Service |
| IRDAI | Insurance Regulatory and Development Authority of India |
| LAF | Liquidity Adjustment Facility |
| LI | Labour Input |
| LIC | Life Insurance Corporation of India |
| LC | Letter of Credit |
| M3 | Broad Money Supply |
| MCLR | Marginal Cost of Funds Based Lending Rate |
| MDR | Merchant Discount Rate |
| MFs | Mutual Funds |
| MFIs | Micro Finance Institutions |
| m-o-m | Month-on-Month |
| MoU | Memorandum of Understanding |
| MPC | Monetary Policy Committee |
| MPD | Monetary Policy Department |
| MSF | Marginal Standing Facility |
| MSMEs | Micro, Small and Medium Enterprises |
| MSS | Market Stabilisation Scheme |
| N.A. | Not Available |
| NBFCs | Non-Banking Financial Companies |
| NDTL | Net Demand and Time Liabilities |
| NEFT | National Electronic Funds Transfer |
| NETC | National Electronic Toll Collection |
| NHB | National Housing Bank |
| NPCI | National Payments Corporation of India |
| NSSO | National Sample Survey Office |
| PMI | Purchasing Managers’ Index |
| PMJDY | Pradhan Mantri Jan Dhan Yojana |
| PoS | Point of Sale |
| PPI | Prepaid Payment Instrument |
| PSU | Public Sector Undertaking |
| RBI | Reserve Bank of India |
| SBI | State Bank of India |
| SBNs | Specified Bank Notes |
| SCBs | Scheduled Commercial Banks |
| SIAM | Society of Indian Automobile Manufacturers |
| UPI | Unified Payment Interface |
| US | United States |
| USSD | Unstructured Supplementary Service Data |
| VR | Variable Rate |
| WACR | Weighted Average Call Money Rate |
| WALR | Weighted Average Lending Rate |
| y-o-y | Year-on-Year |